D+DH In-Depth is our premium, comprehensive corner on Americaxe2x80x99s No. 1 game animal. In this graduate-level course, wexe2x80x99ll teach you about deer biology, behavior, and ultimately, how to become a better hunter. Want to be the first to get our premium content? Become a D+DH Insider for FREE!
Studies prove that observational deer herd estimates are highly unreliable for management strategies.
By John J. Ozoga
Deer hunters tend to rely heavily upon deer sightings to determine hunting prospects and potential hunting hot spots.
Researchers and managers also employ observational data to assess aspects of deer biology, such as relative abundance, adult sex ratios and fawn production. Deer managers use such data to set management regulations and evaluate management effectiveness. These determinations assume equal observability of sex and age classes of deer and that changes are indicative of real changes in population size and/or herd composition.
While researching material for my September 2008 Deer & Deer Hunting article regarding adult-deer sex ratios, it became apparent that hunters and biologists often draw rather debatable conclusions based upon deer observational data of questionable value. Research shows, for example, that observability and flightiness of bucks, does and fawns can vary seasonally and according to a host of other factors. Hence, deer sightings may or may not accurately depict the status of the local deer population.
Research Protocol
Researchers have followed various protocol to investigate deer observability and assess the accuracy of field counts used to determine deer abundance and aspects of herd composition.

Michael Zagata and Arnold Haugen reported on one of the earliest studies to determine how light intensity and various weather factors influenced the number of deer seen from elevated tree blinds in Iowaxe2x80x99s Pilot Knob State Park. Observers saw 5l7 deer during morning and evening (May to September) when deer were moving between bedding and feeding sites.
Probably one of the most frequently referred to studies was conducted by Robert Downing and his colleagues in a Virginia enclosure and in Texas. These investigators counted deer monthly (July to December) along roadways during mornings and evenings over a three-year period to determine the accuracy of sex and age ratio counts.
A similar long-term study was reported by State University of New York researchers headed by Richard Sage. Those researchers tried to determine factors that influence visibility of whitetails along forest roads in the Adirondack Mountains.
Dale McCullough conducted weekly nighttime spotlight counts for a one-year period along a fixed route in southern Michiganxe2x80x99s fenced George Reserve to evaluate spotlighting as a deer study technique. This investigation provided especially meaningful information because the deer population size and composition within the confines of the 1.8 square mile enclosure were known.
Two other observational studies examined sex-age differences in the flight behavior of whitetails. Donald Behrend and Robert Lubeck studied summer flight behavior of deer along roadways in two areas xe2x80x94 one hunted and one unhunted xe2x80x94 in the Adirondacks of northern New York.
Michael Stuwe also made direct comparisons of the flight order of deer according to sex-age classes and examined the development of flight behavior in young deer near Front Royal, Virginia.
Given the diverse nature of white-tailed deer, these investigations sometimes produced contrasting results. In other stances, however, consistent biases and distinct seasonal trends in deer observability were noted.
Here are the Top 6 contributing factors:
1. Time of the Year
McCullough found the best time of the year to conduct spotlight counts depends on the purpose of the counts. Numbers of deer spotlighted were lowest in June and July and highest in late October through December.
In June and July, about 12% to 13% of the deer known to be present were observed. From December through April, about 30% to 45% of the population was observed during each count. McCullough considered October and November the best months for spotlighting deer because thatxe2x80x99s when counts were highest and variance between weekly counts the lowest.
Based on observations of 6,237 deer along forest roads in the Adirondacks, Sage and his group concluded that summer deer observation rates were correlated with fluctuations in regional deer abundance and served as good predictors for autumn buck harvests. Also, deer observation rates declined (by 82%) with hunting because of resultant lower deer densities. In addition, hunting removed the most visible deer xe2x80x94 many of which were marked xe2x80x94 with home ranges near roadways. Apparently, an increase in wariness of surviving deer following hunting also contributed to reduced observation rates.
Downing and his coworkers found deer observability highly variable, from month to month and year to year; there was no period in which fawns, does and bucks were equally observable.
2. Fawn-Doe Counts
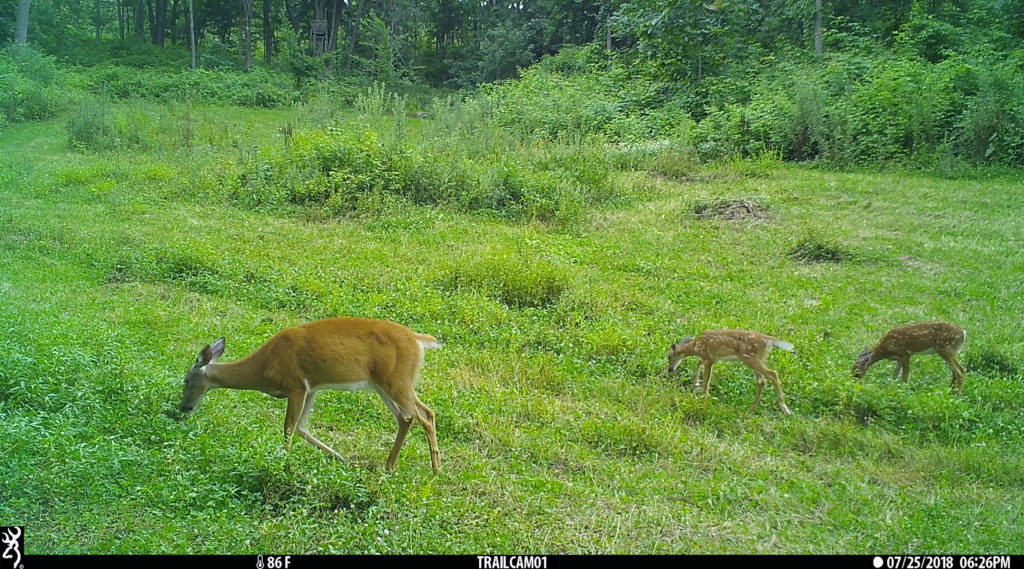
McCullough had no problem identifying fawns unless spotlighted at great distance. However, fawns were seldom observed shortly after birth in the George Reserve studies. Although the enclosure was known to harbor in excess of one fawn per doe, observed ratios were almost always lower. Fawn observations increased in proportion into late summer and autumn but did not approach their representation in the actual population until April, when they were about 10 months old. Hence, for most of the year, fawns were greatly underrepresented in spotlight counts.
 Downing and his group reported that fawns were less observable than does during summer and early fall, with observed ratios nearest to expected in November and December. However, they reported considerable difficulty in differentiating fawns and yearling does in late fall.
Similar results were reported by Sage and his coworkers in the Adirondacks. They found the proportion of fawns observed during the summer season (when spotted) was lower than the proportion of fawns in local hunt samples.
3. Adult-Deer Sex Ratios
In the George Reserve, bucks were typically underrepresented in the spotlight counts, particularly during December through June, compared to their known ratio. Only during July were males observed in approximate proportion to their presence in the herd. Distinguishing small males from females became especially difficult after antler loss. However, females were observed out of proportion even during the rut in November.
Downing and his group reported highly variable adult sex ratios based on observations, and results differed between Virginia and Texas study areas. In Virginia, bucks and does were seen at about the same rate in August and November. In Texas, bucks were seen at a higher rate than does in July, and at a lower rate than expected in October.
In the Adirondacks, researchers also noted that antlered deer were usually seen less frequently than females. They also reported highest antlered deer observations during July and November. However, yearling bucks contributed heavily (82%) to total buck observations.
4. Deer Activity Patterns
In Iowa, researchers concluded that deer were highly crepscular, since the number of deer sighted was affected by sunrise and sunset times. That is, fewer deer were seen the farther the observation was made from the time of sunrise or sunset.
In the morning, bucks apparently returned to forest cover earlier than adult females and fawns and, therefore, were nearly absent from the sample. Likewise, in the evening, fewer bucks were sighted, suggesting that they were inclined to move later when it was too dark to see.
In contrast, Sage and his group observed deer with equal frequency during all daytime periods in June, July, and August.
Other studies in the same area indicated deer activity patterns were crepuscular in May, but that deer were active throughout daylight hours in August and October.
In the George Reserve, McCullough compared the number of deer observed by spotlight counts that were active as opposed to being bedded. He concluded that deer were most active in April, May and November, when 73% to 83% of those sighted were standing. The highest percentage of bedded deer (51%) was recorded in June.
5. Weather Effects
Zagata and Haugen found that maximum temperature, minimum temperature, wind direction and wind velocity significantly influenced the number of deer sighted. At dusk, more deer were observed moving into cropland when the wind velocity increased. Also at dusk, deer moved out to feed earlier when temperatures were colder, but they did not return to the timber in the morning because of the cold.

At dawn, more deer were sighted when the wind was from the north, but investigators didnxe2x80x99t seem to know why. On average, 1.79 more deer were observed per sighting with snow cover than without it.
McCullough examined the effects of various weather factors on spotlight counts of deer during winter (autumn leaf-fall to spring greenup) and summer (greenup to autumn leaf-fall). In winter, deer counts decreased as snow depth increased. In summer, cool, moist nights seemed to favor high spotlight counts. However, further examination of the summer data revealed that these results were xe2x80x9cartifactsxe2x80x9d associated with season, and higher spotlight counts occurred in early spring and early fall.
As a result, McCullough concluded the following:
xe2x80x9cThe rather surprising conclusion from the analysis of weather data is that, with the exception of winter snow depth, weather had remarkably little influence on spotlight counts.xe2x80x9d
6. Habitat Effects
In the Adirondacks, deer were more likely to be seen in hardwood forest cover than in hardwood-conifer and conifer cover types. Likewise, logged sections had more deer observations than expected, whereas uncut areas had fewer sightings than expected. Although openings comprised only 1.4% of the roadside cover, 7.7% of the deer observations were made in such cover.
As a result, Sage and his coworkers concluded the following: xe2x80x9cThe activities of timber harvesting that produce small openings along roads, as well as those naturally created, can significantly increase deer observation rates. Whether this is due to vegetative response, which attract deer, or increased visibility was not determined but is probably a combination of both.xe2x80x9d
In a companion study, these same researchers found a five-fold increase in observation rates of deer following roadside cultural treatment. They concluded that increased deer presence accounted for 60% of the increase and better visibility accounted for 40%.
One of the major problems McCullough encountered in his study was an area of dense tamarack swamp that could not be spotlighed effectively. He also noted that deer sex-age use of habitat types varied seasonally. Grasslands received the heaviest use, especially during winter and spring.
During summer and fall, deer use shifted to hardwood forests. However, amount and timing of rainfall, acorn crops, and time of snow cover all influenced food availability, and ultimately variations in the number of deer sighted.
McCullough concedes that if all habitat types were equally open to spotlight penetration results probably would be better. However, he is quick to add that good deer range always contains some areas with dense escape cover that would present the same problem.
Conclusions
Results from these studies demonstrate how variable and seriously biased deer observational data can be xe2x80x94 from month to month, year to year, and area to area. Antlered bucks and fawns are almost always underrepresented. On the other hand, does tend to be overrepresented, often even during the rut, which probably helps contribute to the impression that adult sex ratios are seriously skewed to females.
Given the problems encountered in differentiating fawns from yearling does in late fall, Downing warned that xe2x80x9c… errors are inevitable. Differences in observability between fawns and does in summer and early fall mean that such counts may never be accurate.xe2x80x9d
McCulloughxe2x80x99s investigations were particularly revealing because his study population was of known size and composition. In his words:
xe2x80x9cResults that seemed reasonable at the time were subsequently recognized as erroneous when the reconstructed population size and composition became known. While these remarks are directed specifically at spotlighting results, it seems likely that the same conclusion holds for most observational study techniques for deer.xe2x80x9d
xe2x80x94 John Ozoga is a retired deer research biologist with more than 30 years of professional experience. He has been Deer & Deer Huntingxe2x80x99s research editor since 1994.
Want to be the first to get our premium content? Become a D+DH Insider for FREE!
Deer Management: The Balancing Act of Buck and Doe Harvests